enVisual Menu > Clients > Relationships
This is the first menu found under clients. This section displays all relationships that are linked to an entity. This section allows the view and maintenance of relationship between the contact and clients. Relationships can be created in a multitude of ways and can be viewed by either with relationships or organisation chart. This section can be controlled by security which can be set at Settings > Security > System Security > Clients > Relationships.
Relationships
This displays the relationship and relation type of a client or entity. How they are related in a grid format, it also shows if they have direct or indirect relationship to the entity/client. Here, user can also conclude and un-conclude relationship as required using the right click options. Relationship can also be created here and edited as required using the right click options. Note: When the Relationship menu is accessed with no entity/client selected, user will be prompted to select one. Additional information can be displayed on the grid using the Filter Right Click Menu > Column Chooser. More about grid filters can be found in Filters.
By pressing the ![]() will drill down the entity to reveal more information about the relationship available as displayed below
will drill down the entity to reveal more information about the relationship available as displayed below

The search box can be used to search for entity that might be related in the relationship. This can be very useful when an entity has lots of relationship with other entities. This enable quick search to be done rather than drilling down which could be time consuming.
A concluded relationship with end date will be highlighted in red while a relationship with end date only and not concluded will be highlighted in blue.
To Add a relationship, right click select add to load up envisual – Relationship Add wizard
Parent Entity: this is the parent entity that the relationship is attached to. This has been defaulted to the selected entity but can be changed as required using the dropdown. The search button can also be used to search for the required entity by clicking on the search icon to load up the global search wizard.
Child Entity: this is the child entity the relationship is attached to. This field is mandatory and cannot be left blank. The dropdown will contain all entities in envisual application.
Type: this will display all envisual types of relationship that is available. This field is also mandatory.
Start Date: to input when is the start date of the relationship that is been added. The date has been defaulted to current’s date but can be changed as required.
Holding: the input what is the relationship holding to the entity
Key Relationship: tick box to be used to display if relationship a key relationship or not. when ticked, simply means it is a key relationship and when unticked is not.
Display in Tree and Chart: when ticked will display the relationship both in tree and chart and when unticked will not display the relationship.
Notes: to be used to input any notes or contents required.
Concluded: this is to be used to conclude relationship. When ticked, will enable the date field, which has been default to current date, which can also be changed as required.
Notes: to input any relevant required
Use End Date: to be used to input relationship end date. Date field work similar to conclude date field.
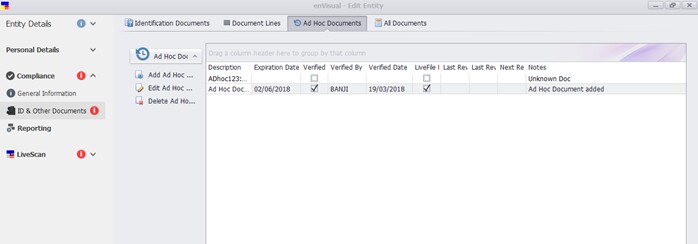
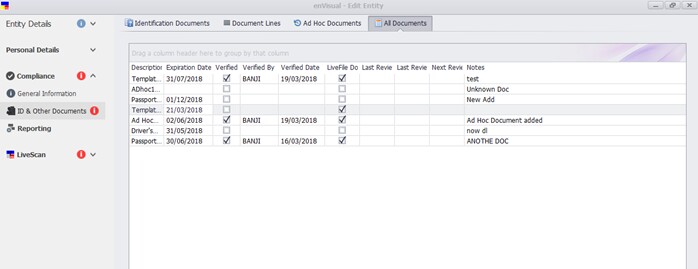
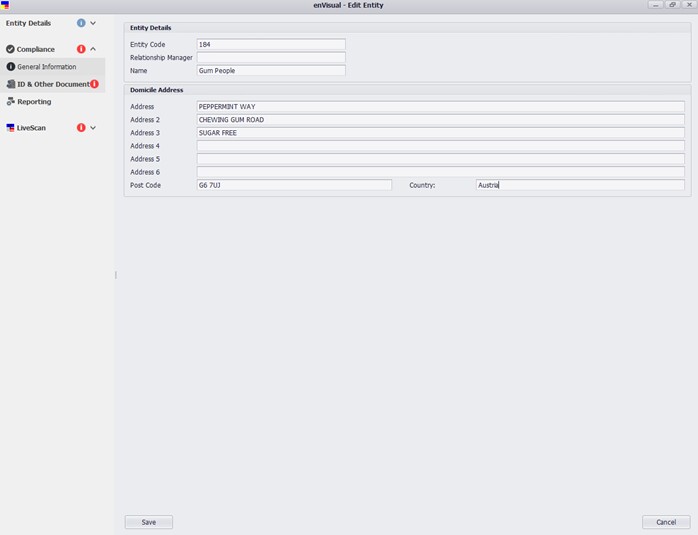
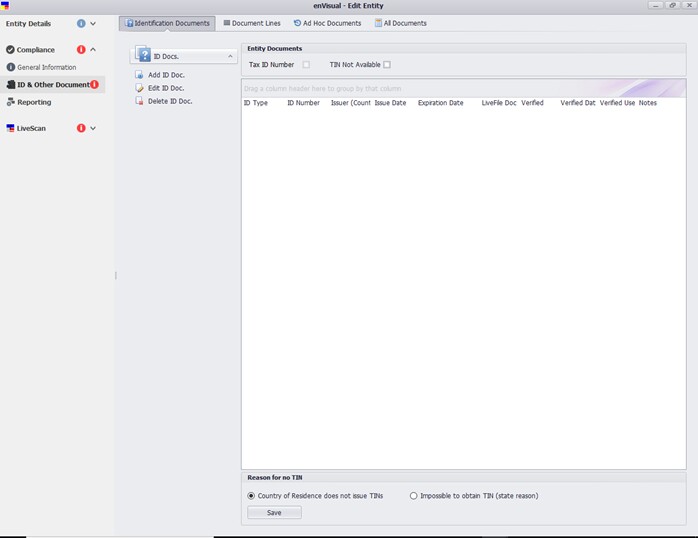
To Edit a relationship, right click on the relationship and select edit, this will load up envisual – Relationship Edit wizard.
The parent, child and type field has been greyed out. However, Start Date, Holding, Key Relationship, Display in Tree and Chart, Conclude and Use end date can be edited as required.
To Delete a relationship, right click on the relationship and select delete. Other right click options are: Switch to Entity, Conclude and Unconclude.
Organisation Chart
This enable relationship to be viewed in a chart mode. Note: When the Organisation menu is accessed with no entity/client selected, user will be prompted to select one. Clicking on the organisation chart displays the screen below
To display an organisation chart, simply select the relationship type that is required in the group/type filter section. Then press apply button to make it display on the chart as displayed below.

Pressing the – button in the chart above will hide the chart as below
And pressing + button will display the relationships that is found under the entity.
Filters: User can auto hide the filter tab using the ![]() pin icon. When selected, and clicked away into the chart, will hide the bar and leave a link at top left of the screen
pin icon. When selected, and clicked away into the chart, will hide the bar and leave a link at top left of the screen
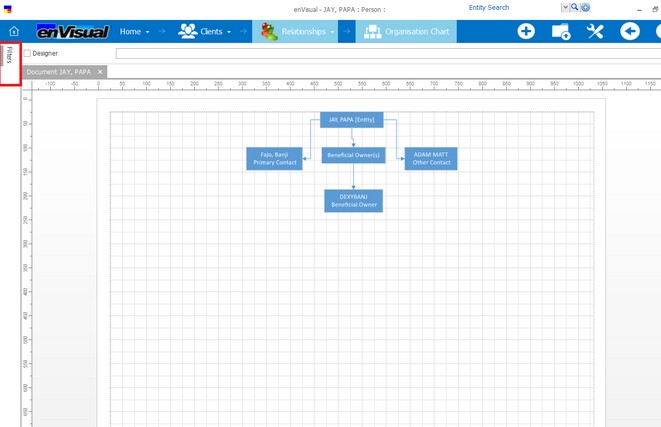
To display the filter bar again, move the cursor towards the filter link, this will bring back the filter tab again when needed. This will also auto hide again once the cursor moves away from it. To disable the auto hide, click on the pin again to dock the filter tab.
Other options available under the filters are: Level: this can be used to display how many level of relationship/charts to be displayed. There are 10 levels available that can be selected. Note, a pop up message will be displayed when generating a chart with high amount of data/attachment to notify users.
Show Group Headers and Show Conclude tick box can be used to display or hide them respectively. Group/Type Filters displays all relationship group that has been added in envisual. Selecting a relationship group in the dropdown will tick the relationships types that has been added for the group (this can be done in Configure > Maintenance > enCentral > Relationshop Groups). It is also possible to display more than one relationship group at a time. This can be done by selecting another group again, which will update the filters and add the new group selected. To remove filters or group that is no longer required, user will have to right click deselect all and then reselect the required group again.
Editing, Saving and Reloading Saved Charts
Editing Charts
Charts can be edited as required, which can then be saved to be reused and reloaded when needed.
To edit a chat, user will have to first select the designer tick box, this box can be found just beside the filters section.
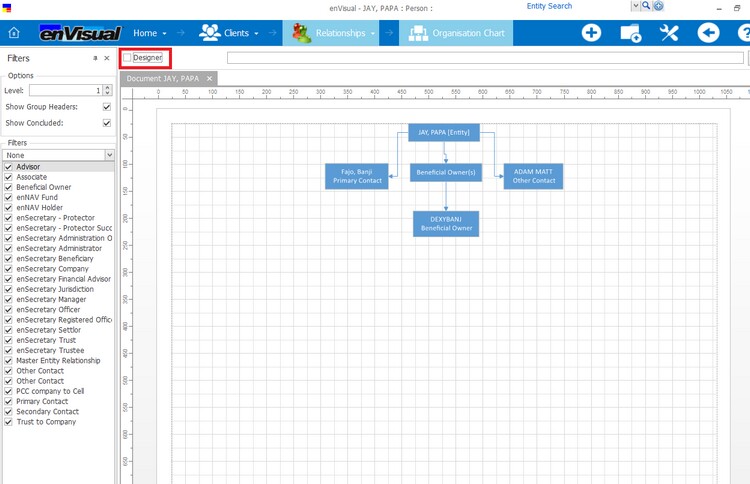
This will then load an editable screen with task bar where the chat can be edited as required and necessary. This option is also available on the chart by right clicking and then choose the designer option. This will also include additional options for Toolbox and Properties. The organisation chart homepage is default with filters option displayed when first accessed the screen. Additional options are added using the design tick box.
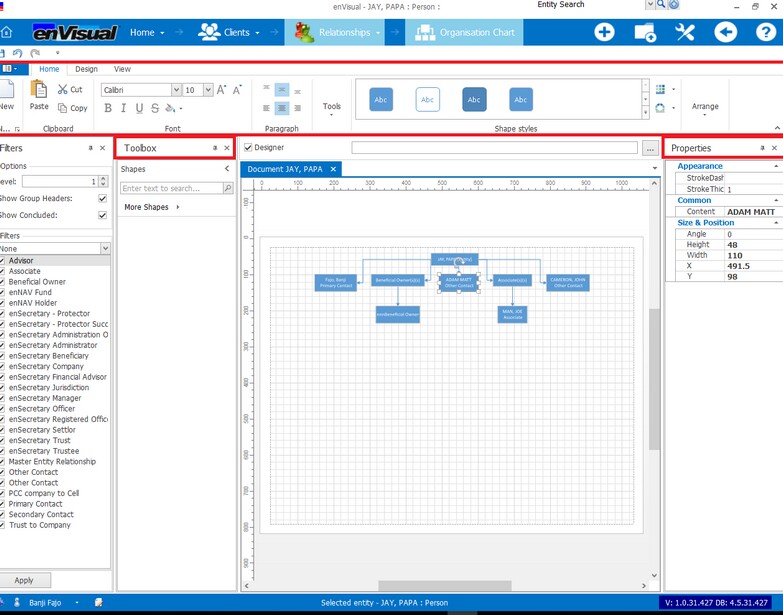
With the edit option, user can then edit the graph. Options available within the edit are: Home, Design, View, Toolbox and Properties.
Home

Major editing options can be found here, these are: Save, Undo and Redo, Create new chart page, Clipboard for copy and pasting, Font settings, Paragraphs alignment, Tools, Shape styles and Arrange.
Pressing the Customize Quick Access Toolbar![]() , beside the redo button, will enable user select what they want displayed on the toolbar and can also decide where they want the tool bar displayed, either above or below the ribbon. Pressing the
, beside the redo button, will enable user select what they want displayed on the toolbar and can also decide where they want the tool bar displayed, either above or below the ribbon. Pressing the ![]() at the far right of the home bar, will hide the home bar (or any menu bar that is been displayed to include Design and View). To display the home option again with its full options, click on Home and then
at the far right of the home bar, will hide the home bar (or any menu bar that is been displayed to include Design and View). To display the home option again with its full options, click on Home and then ![]()
Design

Options available are: Page setup, Themes, Options and Layout.
View
Here, user can adjust the viewing setting, how they want the chart displayed. Options available here are: Show, Zoom and Designer.
Unticking the designer box or right clicking again and selecting the designer, will remove the edit tab, toolbox and properties from the screen. The toolbox and properties have similar option to filter, where they can be hidden if required using the auto hide. The Toolbox can be used to select desired shapes while the Properties show details about the box in the chart that is been selected.
The designer is to be used to edit charts, if the tick box is not ticked, user will not be able to edit charts. The view will just be view only.
Note: If the Filters, Toolbox and Properties tabs are closed using the ![]() button, to bring them back, user will have to untick and tick the designer tick box again.
button, to bring them back, user will have to untick and tick the designer tick box again.
Saving Charts
Once the chart has been edited as required, user can then click on the ![]() to select save as from the drop-down options, which will then load up saving file folder. Other options available here are: New, Open, Save, Print and Export As.
to select save as from the drop-down options, which will then load up saving file folder. Other options available here are: New, Open, Save, Print and Export As.
Reloading Saved Charts.
There are two ways to reload a saved chart, one option is to click on the ![]() available just beside the designer, which will open file folder to enable user select the saved file, which will then display in the rectangular box and add another chat page/tab to the screen.
available just beside the designer, which will open file folder to enable user select the saved file, which will then display in the rectangular box and add another chat page/tab to the screen.
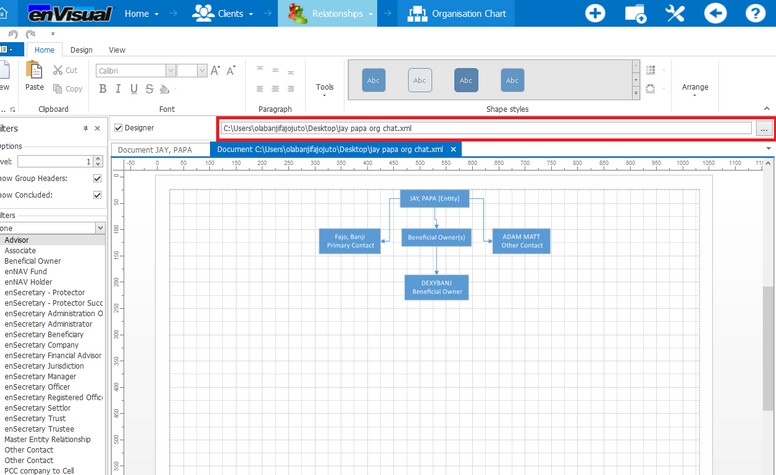
The other option available for reloading saved charts is by clicking the ![]() and then select Open from the drop-down option.
and then select Open from the drop-down option.
Multiple Chart Options
In the organisation chart section, user can have multiple charts on display using the New Icon available on the edit tab. Once pressed, a new chart screen will be added onto the page, where user can then create a new chat or copy and paste into it as required.
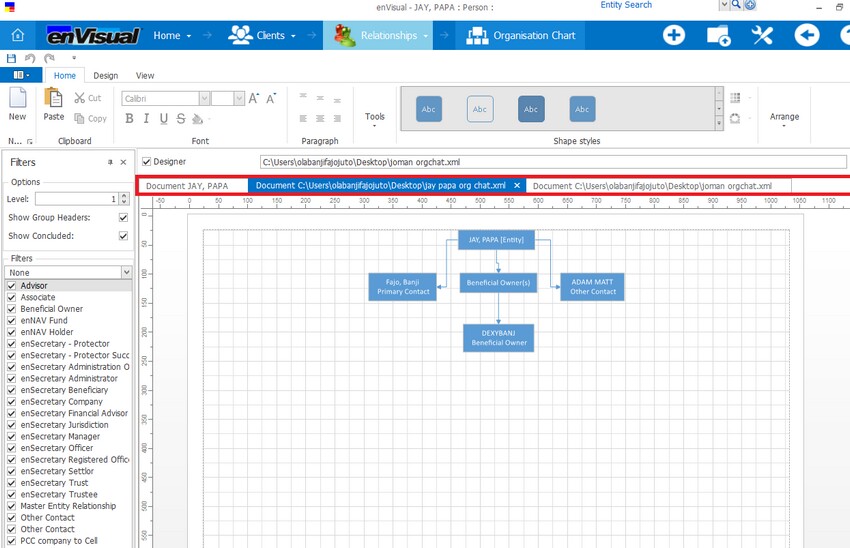
The highlighted chart screen is displayed with the ![]() sign. User can use this close chart screen that is not required anymore.
sign. User can use this close chart screen that is not required anymore.
Enhancements: Owners Chart
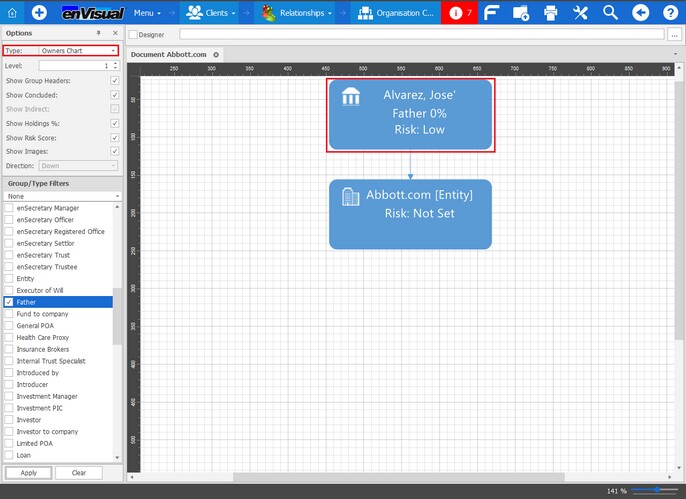
This will display the indirect relationship either above or below the entity selected, based on the Above/Below flag configuration set in the Relationship Types Maintenance section. For example, configuring the Father relationship type to Above will display the Father indirect relationship above the Direct Relationship entity instead of below.
Father set to BELOW
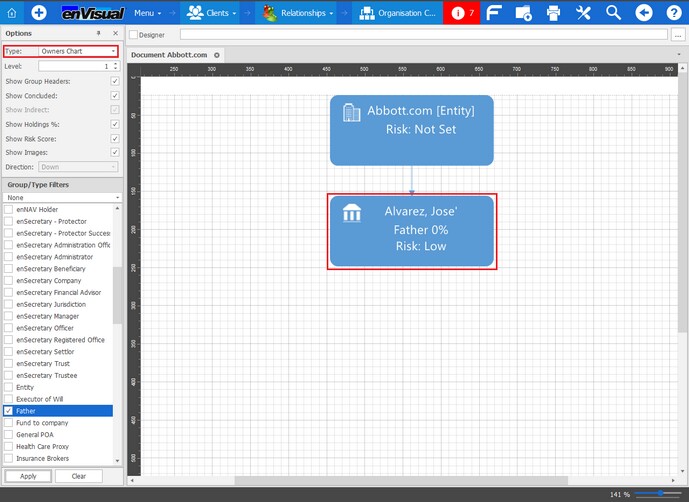
Father set to ABOVE
